
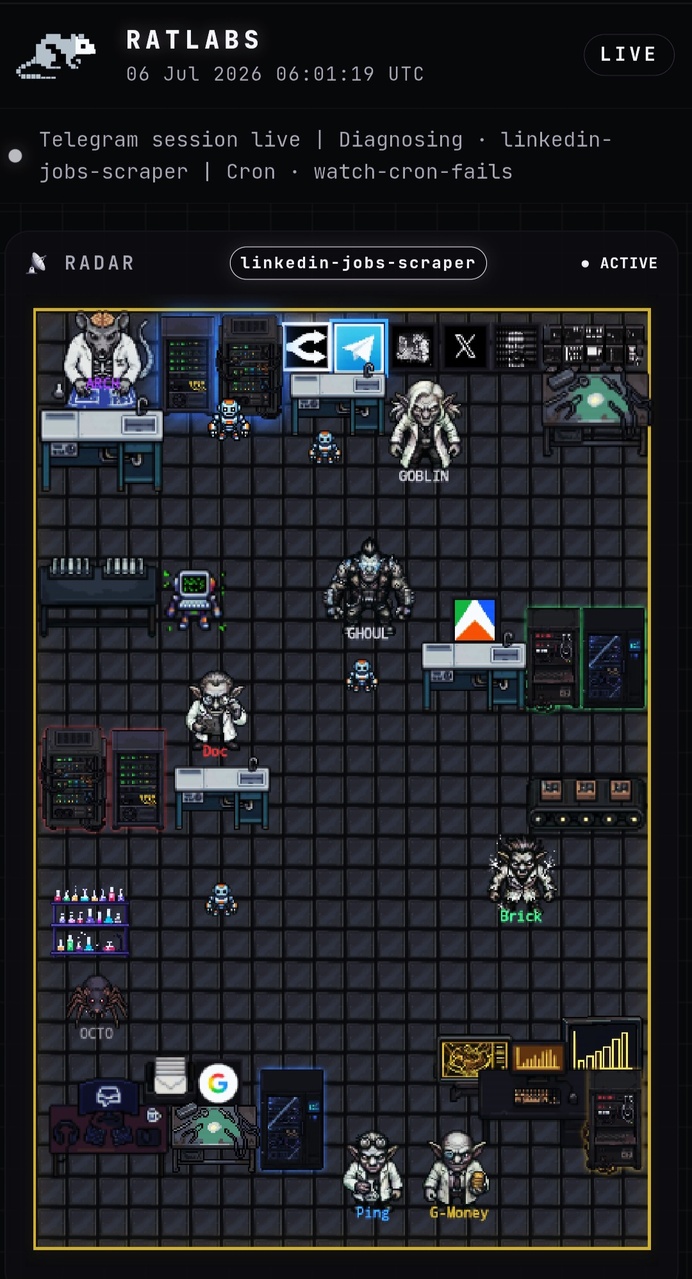
TL;DR: I built a pixel-art dashboard that shows me everything my AI agents are doing - live. Inspired by agent-town's visual character concept and the dashboard ideas in Hermes Agent and OpenClaw apps, I created a read-only topology map where every agent is a character, every service is a rack, and every pipeline lights up when it runs. Customer emails, builds, research, finance reviews - all playing out in a pixel world I can glance at from my phone. Here's why it changed how I work.
The Inspiration
It started with an open-source project called agent-town.
Seeing the concept of agents as visual characters in a shared space clicked something in my head. Around the same time, I was reviewing the Hermes Agent and OpenClaw apps, and I noticed other builders putting mission control dashboards on their phones. Not complicated Grafana setups with 47 panels. Just clean, at-a-glance views of what their agents were actually doing right now.
That combination - agent-town's visual characters plus Hermes and OpenClaw's dashboard concepts - is how Mission Control came to life.
I'd been running my agent system for months through Telegram alone. It worked great - I'd type a command, get a result, move on. But I realized I had no ambient awareness of what was happening when I wasn't actively asking. Was a build running? Had a customer email come in? Was the finance check done?
I wanted a window into my own company's operations - something I could glance at from my phone, like looking through a window into a workshop.
So I built one.
Live Demo
Here's a live demo of the dashboard in action - you can watch G-Money (the finance agent) working through a monetization review while Goblin handles a Telegram request in real time.
10-second clip showing agent activity, rack server animations, and the live feed (from an earlier demo, the lab is still being renovated, the final layout differs). The dashboard is read-only, all actions happen through Telegram.
The Dashboard Zones
The dashboard is a single-screen view broken into zones:
The Topology Map sits at the top - a visual network showing every agent, every service, and the connections between them. Each agent is a character sprite standing at their workstation. Goblin has a command terminal. Ghoul has a workbench with actor blueprints. The staff agents each have stations that reflect their domain - Doc has research monitors, Brick has a code editor, Ping has a customer service headset, G-Money has a ticker feed.
The Server Rack sits to the side - a vertical stack of equipment showing system vitals. CPU, memory, disk, and a "lights" panel that blinks when services are active. Each rack unit is a pixel-art server with status LEDs that pulse when that service is running.
Budget Meters show token spend for the current month - green when under budget, yellow at 50%, red at 75% and above. No numbers, just visual status.
The Cron Timeline is a horizontal track showing scheduled jobs - builds, intel scans, health checks, support intake - all laid out on a 24-hour clock face. Running jobs pulse. Completed jobs leave a dimmed trail. Failed jobs flash red.
The Activity Feed scrolls recent events - agents reporting in, pipelines completing, errors caught by the self-heal system. Each entry is one line with an icon, an agent name, and what happened. No log dumps, no noise.
The Characters
Every agent in the system is represented as a pixel-art character. I created these using PixelLab.ai - an AI tool that generates sprite-style character art from text descriptions. There are other tools out there (I'm sure there are better ones), but PixelLab was the first one that worked for me, so I ran with it.
Here's who lives in the workshop:
Goblin - Chief of Staff
*The one you talk to.
Goblin is your primary interface - routes intent, asks for /approve, returns structured summaries. Never does floor work he can delegate. If you could see him, he'd look like a seasoned ops manager who's seen it all and doesn't get rattled when three things break at once.
Runs on: Primary VPS (Hermes Agent)
Model: DeepSeek V4 Flash → Qwen 3.6 Plus → MiniMax M3
Motto: Decides what, not how
Ghoul - Strawboss
*The working foreman.
Ghoul coordinates the staff, reviews output, breaks ties, and still swings a hammer - builds actors, runs QA gates, handles maintenance. The foreman who can do everyone's job but trusts them to do theirs.
Runs on: Secondary VPS (Hermes Agent)
Staff: Doc · Brick · Ping · G-Money
Motto: Oversees how, still does
Doc - Research Center
*Doc's station is a wall of monitors showing data feeds.
Doc scans for demand signals - what do people need NOW - and owns compliance and health. Error-rate audits, ledger integrity, deploy gate reviews. Tells Brick what to build based on real data.
Data source: Apify Store API + social signals → weighted scoring
Motto: Tells Brick what to build
Brick - Actor Engineering
*Brick's workstation is a code editor with a build pipeline status bar.
Brick builds, fixes, and refactors. Also owns infrastructure - system hardening, disk/memory, certs, backup verification. Consults Doc (demand) and G-Money (margin) before building anything.
QA gate: 4 checks (clean run, PPE match, pricing ≥ cost, docs exist)
Motto: Builds what Doc proves people want
Ping - Customer Support
*Ping has a desk with a telephone headset and a monitor showing the customer email queue.
Ping is the friendly face of the lab. Classifies customer emails, checks past interactions from the knowledge base, routes bugs to Brick, and drafts replies. Owns network and gateway liveness too.
Intake: Gmail scan every 2h → classify/route/draft/learn pipeline
Motto: Warm to customers, terse internally
G-Money - Finance
*G-Money's area has a scrolling ticker showing revenue and cost data.
G-Money watches money, never moves it. Tracks token budgets against monthly targets, revenue and margins per product from a ledger, and ROI verdicts on proposed builds. Signs off on margin for every new build.
Data source: SQLite ledger (token_spend + actor_monthly tables)
Motto: "Profitable / money pit / watch it"
How The Customer Support Pipeline Works
One of the most satisfying things to watch on the dashboard is the customer support pipeline. Here's what happens when a customer emails in:
- Intake (every 2 hours): A script scans the email inbox for new messages forwarded by the support filter
- Signal written: A signal file is written to a temp directory
- Classification: An agent picks up the signal, reads the email, and classifies it - bug, feature request, question, complaint
- Memory check: Past interactions are searched in a knowledge base to see if this has come up before
- Route: If it's a bug, the engineering agent is consulted. If it's a question, the knowledge base is searched
- Draft: A reply is written, always wrapped in
[SUPPORT DRAFT - review before sending] - Learn: The interaction is saved to memory so next time it's handled faster
Here's what that looks like in practice - a real customer email about a verification issue:
╔═ INBOUND EMAIL ═══════════════════════════════════╗
From:    Customer <[email protected]>
Subject: Email verification returning false negatives for Outlook addresses

"I've been using your email verification tool for about a month.
Every Outlook.com, Hotmail.com, and Live.com address comes back
as 'invalid' even though they're real inboxes. About 30% of my
leads are getting flagged incorrectly."

╠═ STEP 1 - CLASSIFY ════════════════════════════════╣
→ bug  (consistent false-negative pattern)

╠═ STEP 2 - CHECK MEMORY ═════════════════════════════╣
Miss.  No prior memory entry for this issue.

╠═ STEP 3 - ROUTE (consult engineering) ════════════════╣
Ping → Brick: "Customer reports all Outlook/Hotmail marked
invalid. Can you reproduce? Root cause?"
Brick → Ping: "Confirmed by-design. Major providers (Outlook,
Gmail, Yahoo, iCloud, Proton) always return 250 OK at SMTP.
The code returns 'risky/provider_unverifiable', not 'invalid'.
Fix: clarify label, not logic."

╠═ STEP 4 - RESEARCH ════════════════════════════════╣
Verified via knowledge base. Honesty rule: major providers
always return 250. Return 'risky/provider_unverifiable'.

╠═ STEP 5 - DRAFT ════════════════════════════════════╣

[SUPPORT DRAFT - review before sending]

Hi Customer,
What you're seeing isn't a bug - Microsoft's SMTP servers always
respond with '250 OK' even for non-existent addresses. Same applies
to Gmail, Yahoo, iCloud, and ProtonMail. The tool returns these
as 'risky/provider_unverifiable', not 'invalid'. The documentation
covers this under 'Limitations - Major Providers'.
Best,
Ping @ Lab

╠═ STEP 6 - LEARN ════════════════════════════════════╣
→ Memory: email-verifier-outlook-provider-limitation.md
→ Knowledge base: embedded for future semantic lookup
  Topic: "email-verifier major provider SMTP limitation"
╚═ PING CS REPORT ════════════════════════════════════╝
Classification: bug (by design)
Consult: Brick → confirmed
Draft: Gmail draft ready (review before sending)
Learned: memory + knowledge base updated
The entire pipeline runs without me touching anything. By the time I check my phone, there's a draft waiting for review. I read it, click send if it looks good, or tweak it if it needs a personal touch.
How It's Built
The dashboard is intentionally read-only. All actions - builds, deployments, support replies, pricing changes - go through Telegram. The dashboard is purely informational:
- Backend: A lightweight Python web server (FastAPI) running on the orchestrator machine
- Bound to: A private network interface (Tailscale or WireGuard) - zero public exposure
- No auth portal: You can't log in to it. It's only accessible from the private network
- Activity bridge: A script posts heartbeat signals and event notifications to a JSON file, which the dashboard polls every few seconds
- 90-second liveness window: If the dashboard stops seeing signals from an agent, it shows them as away
The character art was generated with PixelLab.ai - describe the character and setting, and it outputs pixel-style sprites. The server rack, desk, floor tiles, and other environmental assets were done the same way. I'm sure there are other AI pixel art tools out there - Lexica, Midjourney with pixel prompts, or just hand-drawing - but PixelLab was the path of least resistance for me.
Zero third-party analytics, zero telemetry, zero external requests. The dashboard loads its data locally and displays it. No data leaves the machine.
Why It Changed Everything
Before the dashboard, my relationship with the agent system was purely transactional. I'd send a command, get a result, move on. I trusted the agents to do their work, but I had no ambient sense of what was happening.
Now I can glance at my phone and see:
- A customer email being drafted in real time
- A build running through QA checks
- The finance agent lighting up during a monthly review
- Research scrolling by as the intel pipeline runs
- The self-heal system quietly checking services every 30 minutes without any drama
It's given me joy to peek in. Watching the system work is genuinely satisfying - like looking through the window of a busy workshop where everyone knows their job and does it without needing supervision.
The alerts only come when something actually needs my attention. A failed build. A budget threshold crossed. A support email that needs a human touch. Everything else just... runs.
But here's the honest part: I'm still getting used to it. When you've spent years being the person who has to SSH into every box, check every log, and trigger every deploy by hand, letting a system run itself feels weird at first. You get antsy. You check the dashboard more than you need to. You wonder if something's broken because you haven't heard from it in a while.
That feeling fades. It fades faster when you realize the system has caught and fixed things you wouldn't have noticed until they became problems.
This Is Just My Setup
I want to be clear: this dashboard is built exactly how I use it, for what I need. It's not a product. It's not a framework. It's a personal tool that reflects how I work.
- Your agents might have different names, different roles, different domains
- Your topology might look completely different - and it should
- Your character art might come from a different tool, or you might hand-draw it
- Your budget might be tighter or looser
That's the point. The architecture I wrote about in the previous post is designed to be adapted. The dashboard is too. You can add more workspaces, more departments, more zones for completely different purposes - analytics, social media monitoring, IoT device tracking, whatever your system does.
The pattern that works for me is this: characters in places. Every agent is a character. Every service is a place. When the character is at that place doing work, it's visible. When they're idle, they're resting. When something breaks, it's obvious.
That visual language translates instantly, no matter what your agents actually do.
What's Next
The dashboard is never "done" in the traditional sense. I'll keep adding zones as new capabilities come online:
- A factory floor view showing the actor build pipeline stage by stage
- A knowledge graph visualization showing connections between agents, topics, and past solutions
- Character animations - idle bobbing, typing motions, walking between stations
- A night mode that dims non-essential zones when no one's looking
But honestly? Even as it is right now, it's already changed how I think about building. Having a visual, character-driven view of your autonomous system turns operations into a world you can inhabit, not just a set of logs you have to watch.
And that's been the biggest surprise of all - not that the agents work (they do), but that watching them work is genuinely fun.
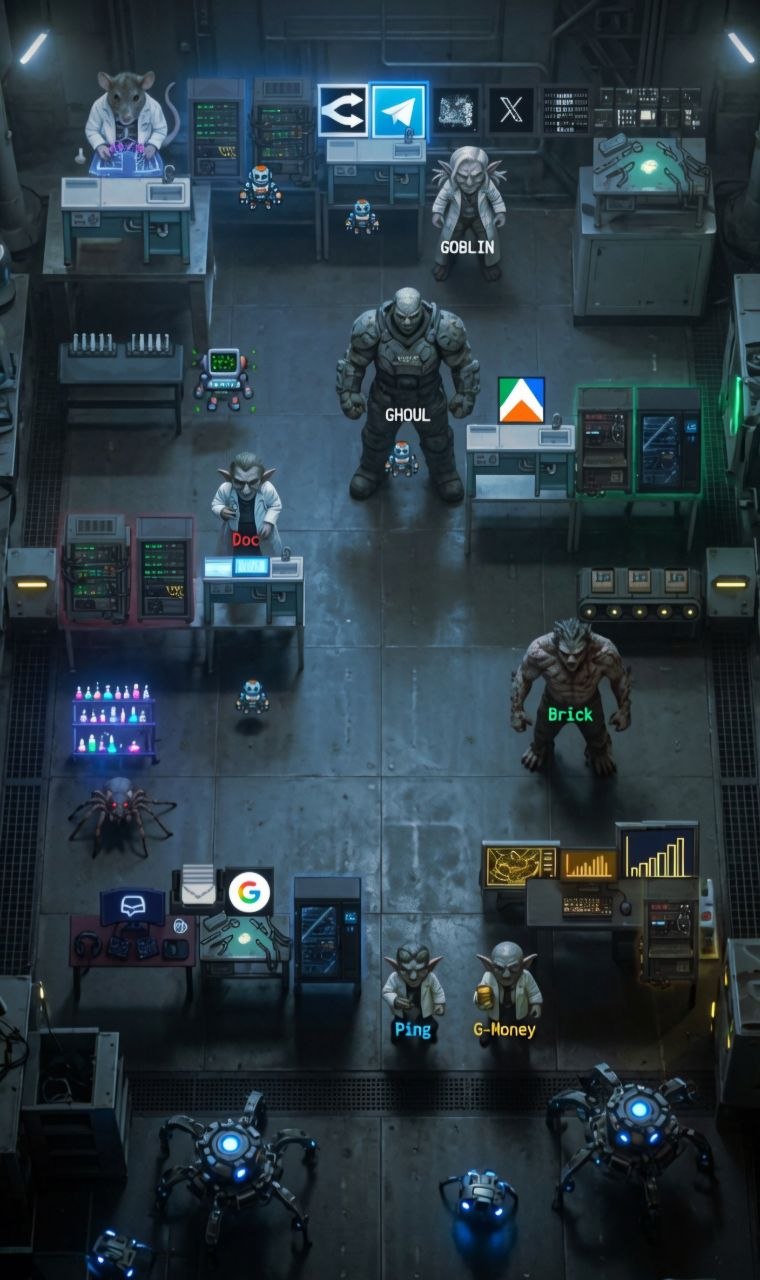
A great rendition of a future setup; this is the direction the lab is heading.
Resources
Tools Used:
- Hermes Agent by Nous Research - The agent framework that powers everything
- FastAPI - Python web framework for the dashboard backend
- PixelLab.ai - AI pixel art generator for characters and environments
- Tailscale - Private network for secure dashboard access
- agent-town - Open-source project that inspired the visual character concept
- OpenClaw - App that influenced the dashboard design
Related Posts: